Quantitative Risk Framework for CISOs & Researchers

The Mathematics of Enterprise Cybersecurity

Demystifying mathematical modeling! A complete deep-dive into the 8 core statistical models powering Data Science & Enterprise Cyber Risk Quantification (CRQ/FAIR/SOC). Clear plain language, rigorous equations, toy calculations, and implementation guides.

Cybersecurity Models Architecture
Infographic Overview The mathematical model matrix addressing 4 vital questions: Will we be breached? How much will it cost? When will it occur? How often?
💡

Goal-Driven Model Selection Matrix

In practice, you never pick models randomly. The mathematical nature of your outcome variable determines 100% of the model choice:

Target Outcome Type Mandatory Model Enterprise Operational Question Action
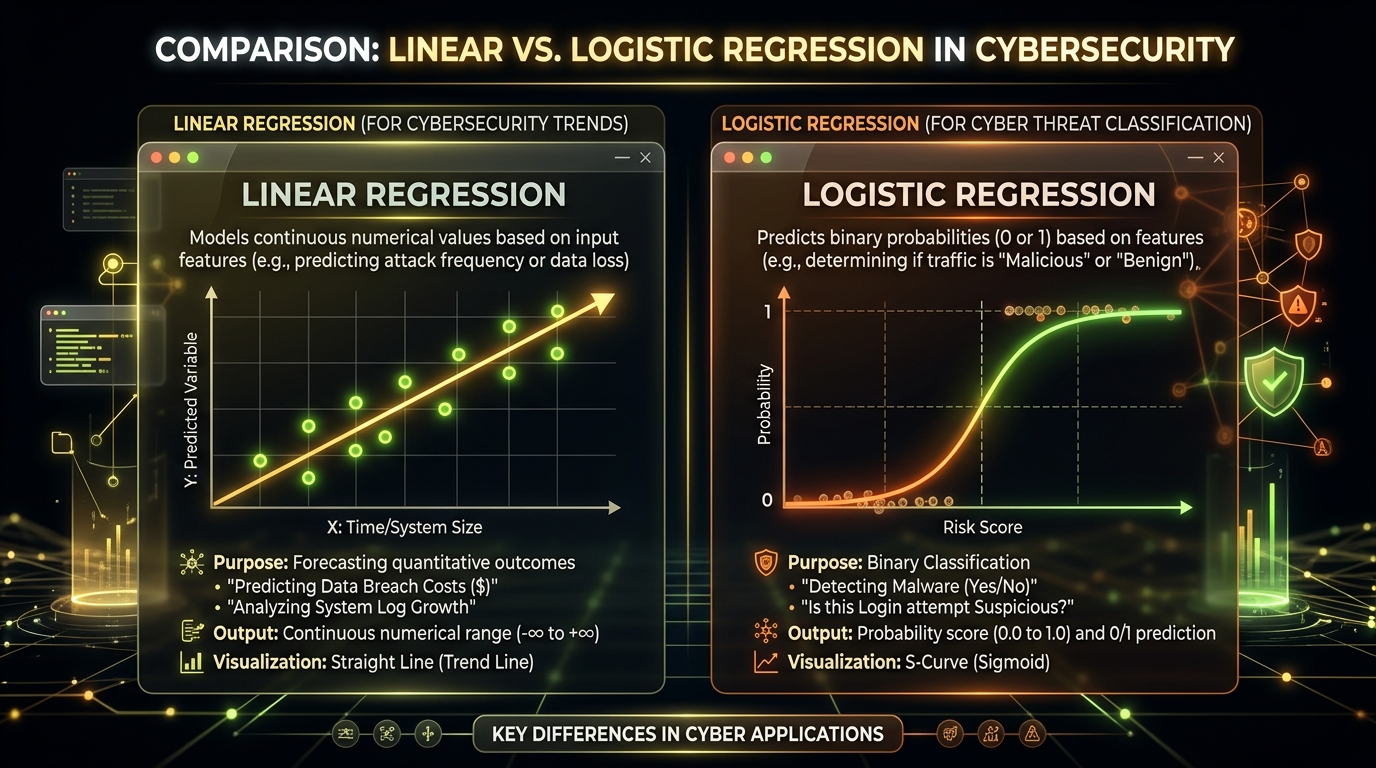
Binary (Có / Không) Logistic Regression Will this employee click the phishing link?
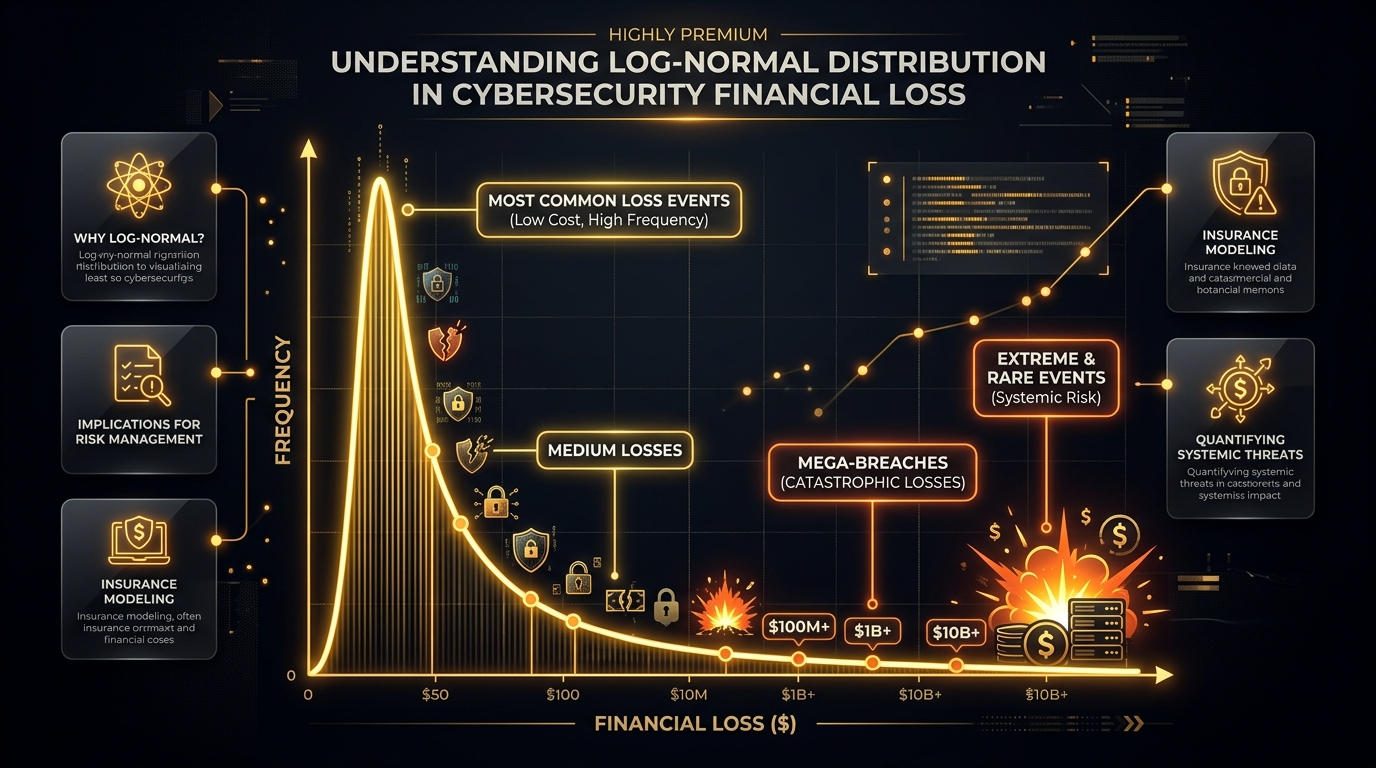
Mất mát tiền tệ lệch nặng (Skewed $) Log-Normal Regression (GLM) If hit by Ransomware, what is our probable dollar loss?
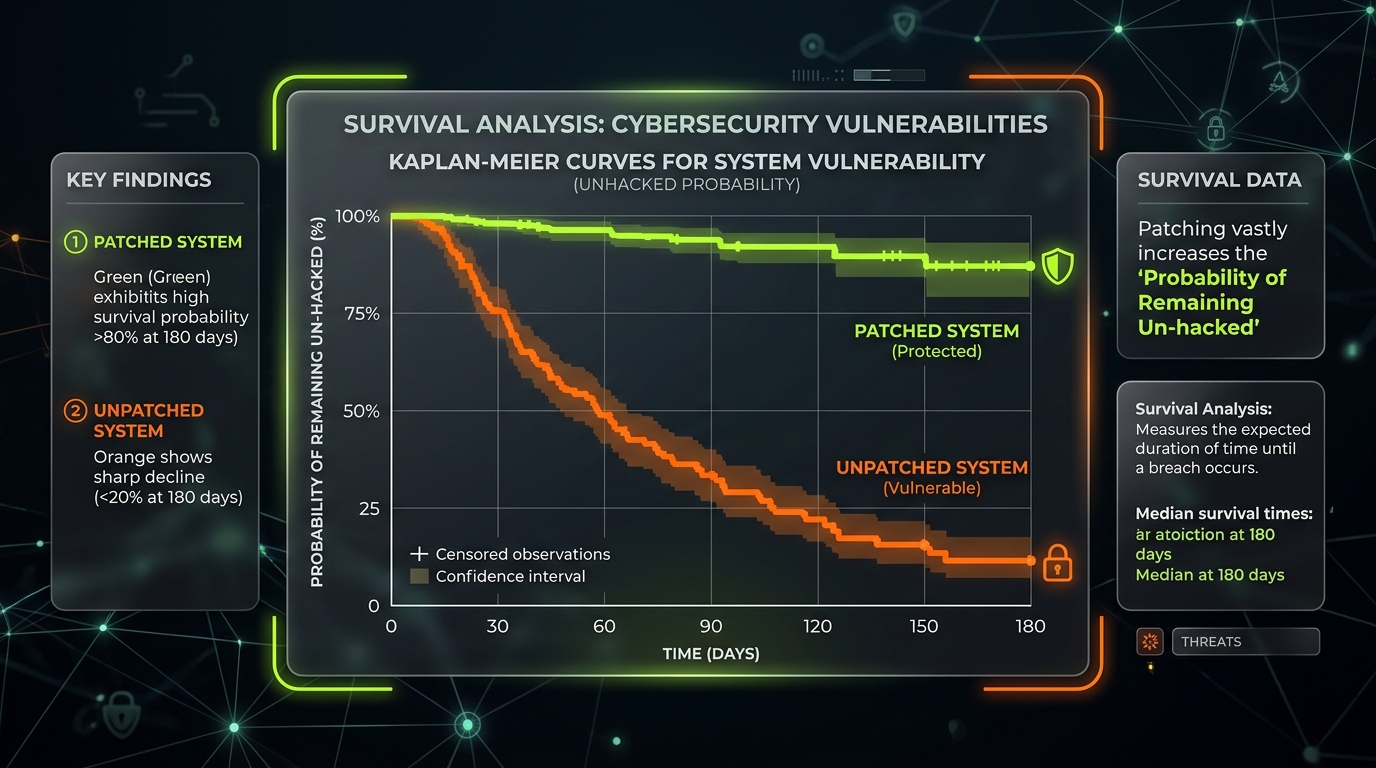
Thời gian sống sót (Time-to-Event) Survival Analysis (Cox PH) How many days until this vulnerability is weaponized?
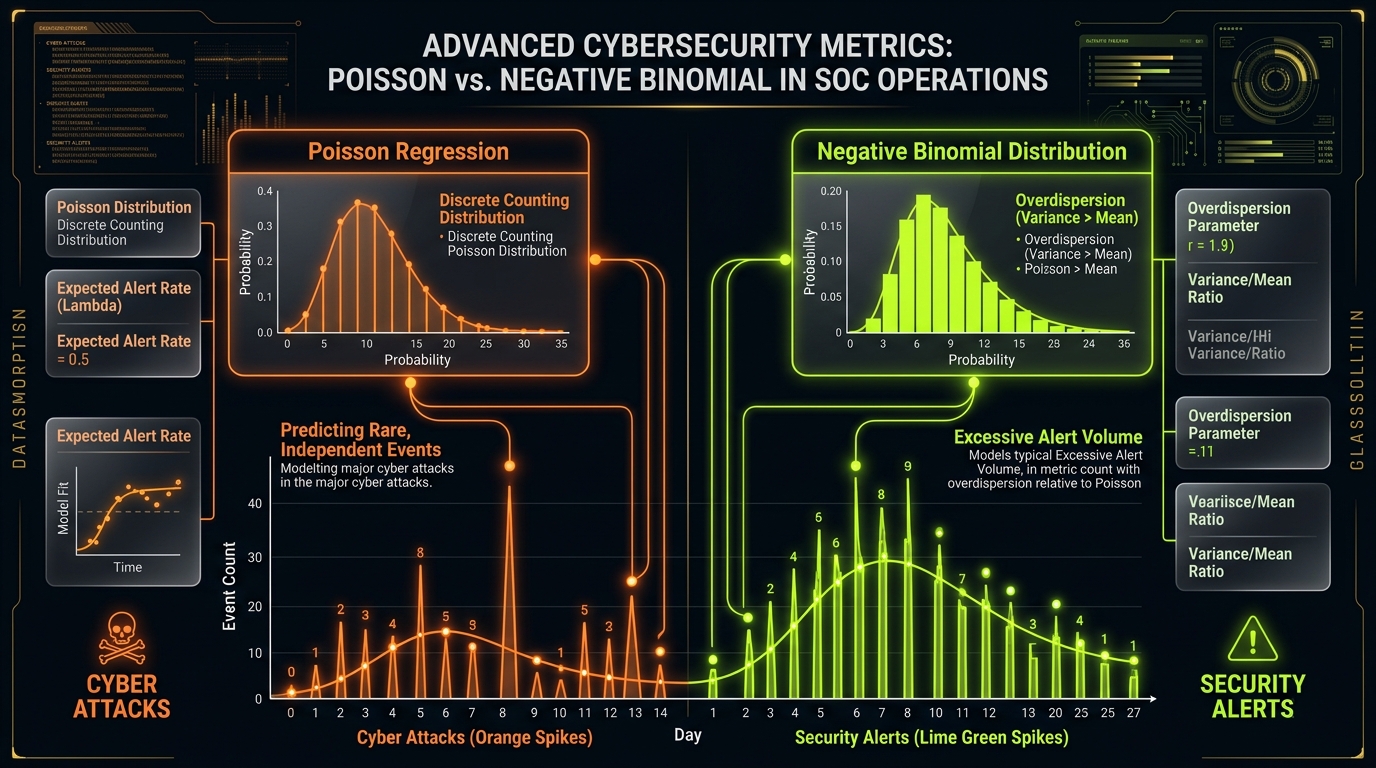
Số nguyên đếm được (0, 1, 2, ...) Poisson / Negative Binomial How many DDoS attacks will strike our API this week?
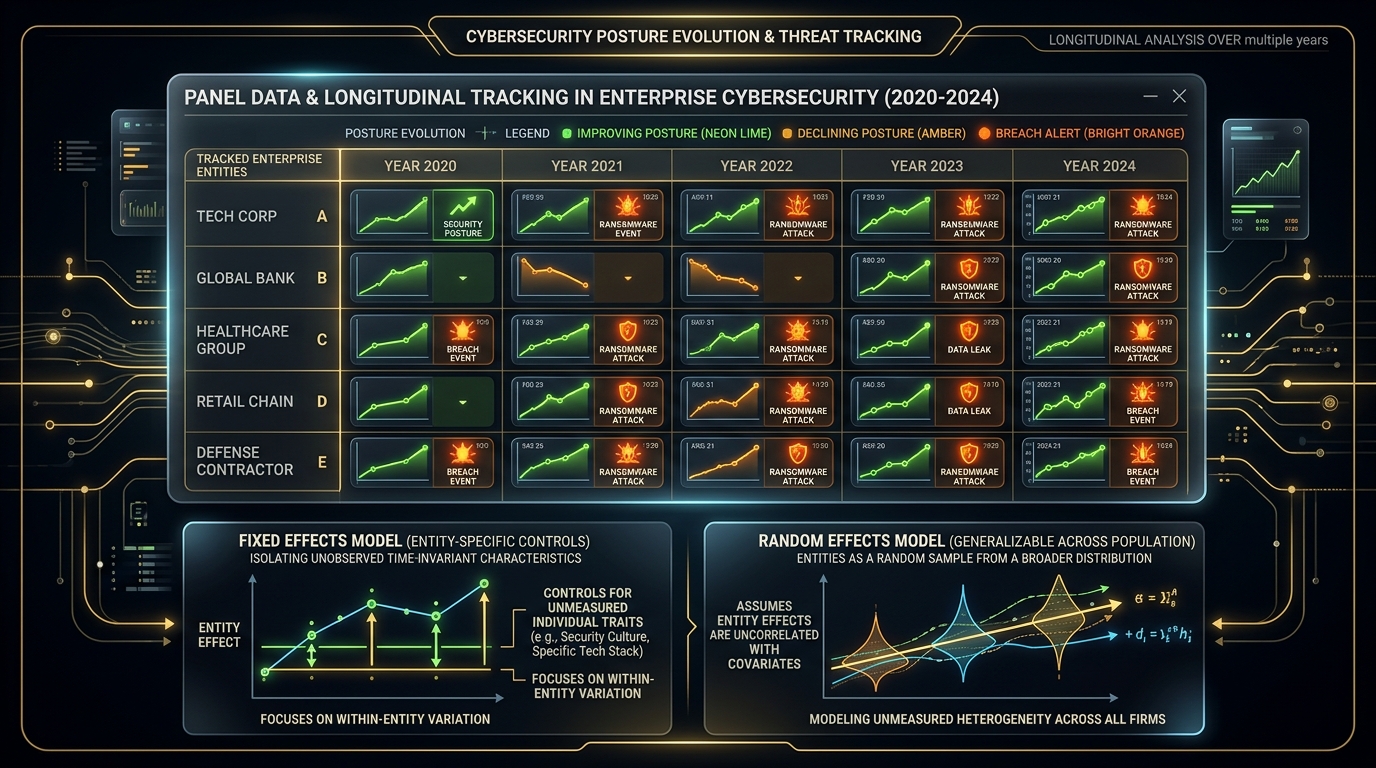
Theo dõi cùng đối tượng qua nhiều năm Panel Data / Longitudinal Did our 2021 security investments actually reduce 2023 risk?
Con số liên tục (-∞ đến +∞) Linear Regression Relationship between headcount and security license cost
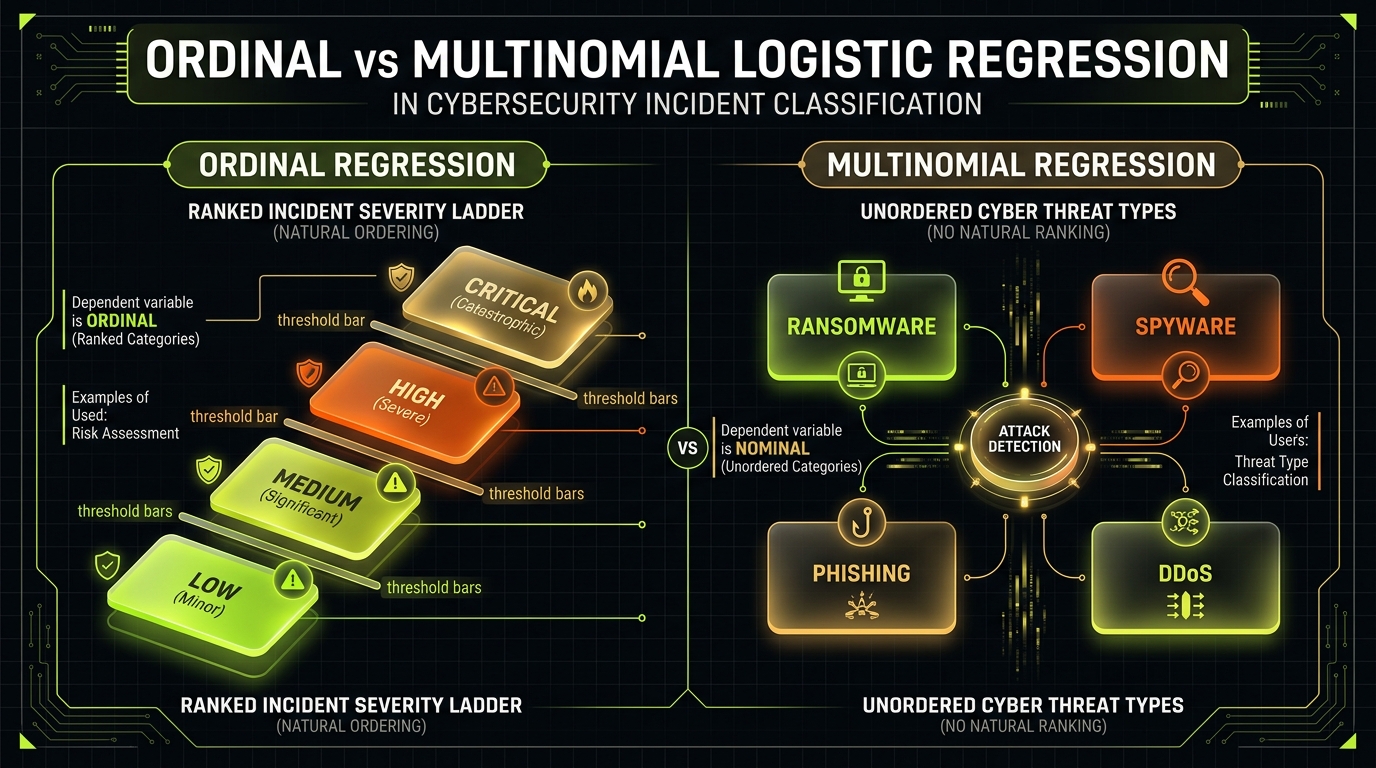
Phân loại có cấp bậc (Thấp < Vừa < Cao) Ordinal Logistic Regression What is the predicted incident severity level (Sev 1 - 4)?
Phân loại không cấp bậc (Ngang hàng) Multinomial Logistic What category of attack is this (Ransomware, Trojan, Spyware)?

Explore The 8 Models In-Depth

Click on any card to navigate to its dedicated monograph with math formulas, step-by-step calculations, and implementation guides.

Domain Focus

Group 1: 5 Core Models in Enterprise Cybersecurity

Model #1 • Binary ⚡

Logistic Regression

Binary Logistic: Predicting Probability of Binary Events

Output $P \in [0, 1]$
Curve Sigmoid (S-Curve)

The core model of the ERCA research paper. Constrains infinite linear predictions into an S-curve from 0% to 100%. Predicts breaches, phishing, and compromises.

Model #2 • Extreme Loss 💰

Log-Normal Regression (GLM)

Skewed Financial Loss & Cyber Insurance (FAIR Framework)

Output $Y > 0$ (Dollars)
Distribution Heavy-Tailed Log-Normal

Cyber losses do not follow a Gaussian bell curve. 95% of breaches are minor, but 5% bankrupt corporations. The industry standard for cyber insurance underwriting.

Model #3 • Time-to-Event ⏳

Survival Analysis

Time-to-Compromise & Vulnerability Remediation Dynamics

Output Hazard Rate $h(t)$
Framework Kaplan-Meier / Cox PH

Moves beyond 'if breached' to 'when breached'. An hourglass computing the exact probability an unpatched vulnerability remains safe over 30, 60, or 90 days.

Model #4 • Event Counts 📊

Poisson & Negative Binomial

Counting Cyber Incidents & SOC Alert Fatigue Forecasting

Output $k \in \{0, 1, 2, ...\}$
Link Function $\ln(\lambda) = X\beta$

Tailored for discrete non-negative integer counts. Forecasts weekly DDoS occurrences and SIEM alert surges to prevent SOC analyst burnout and size infrastructure.

Model #5 • Longitudinal 🔄

Panel Data & Mixed Effects

Multi-Year Enterprise Security Posture & Recurring Breaches

Structure $N$ firms $\times$ $T$ years
Estimation Fixed / Random Effects

Controls for unobserved firm-specific traits (like internal security culture) to measure whether security investments in Year 1 genuinely reduce incident rates in Year 3.

Foundational Tools

Group 2: 3 Foundational Statistical Models in Data Science

Model #6 • Continuous 📈

Linear Regression

Ordinary Least Squares (OLS) & Pitfalls in Cybersecurity

Output Continuous $\mathbb{R}$
Equation $Y = X\beta + \epsilon$

The simplest model yet most dangerously misused. Understand why fitting a linear line to breach probabilities creates fatal logical contradictions (negative risks).

Model #7 • Ranked Order 🪜

Ordinal Logistic Regression

Ranked Multi-Class: Severity Tiers & Incident Triaging

Output Ranked Classes $1 < 2 < 3$
Mechanism Cumulative Logits

When outcomes fall into a strict hierarchy (Minor < Moderate < Severe < Critical). Calculates cumulative threshold probabilities for automated triage.

Model #8 • Categorical 🎯

Multinomial Logistic

Unordered Multi-Class: Attack Vector Attribution

Output $K$ Discrete Categories
Mechanism Softmax / Baseline Logit

Classifies independent outcomes without natural ordering. Predicts which attack vector an adversary will deploy based on target enterprise telemetry.